Delhi woke up to a hazy morning on November 6, 2025 as a thin layer of smog blanketed the city, with the AQI at 278 in the ‘poor’ category and likely to deteriorate to the ‘very poor’ range by evening, according to the forecast.
UPSC MAINS SYLLABUS RELEVANCE: GS 3:
“conservation, environmental pollution and degradation, environmental impact assessment.”
ABOUT AIR POLLUTION:
Definition: Air pollution is the presence of substances in the atmosphere—such as gases, particulates, or biological molecules—in quantities that are harmful to human health, living organisms, or cause damage to the natural environment and built structures.
CAUSES OF AIR POLLUTION IN INDIA:
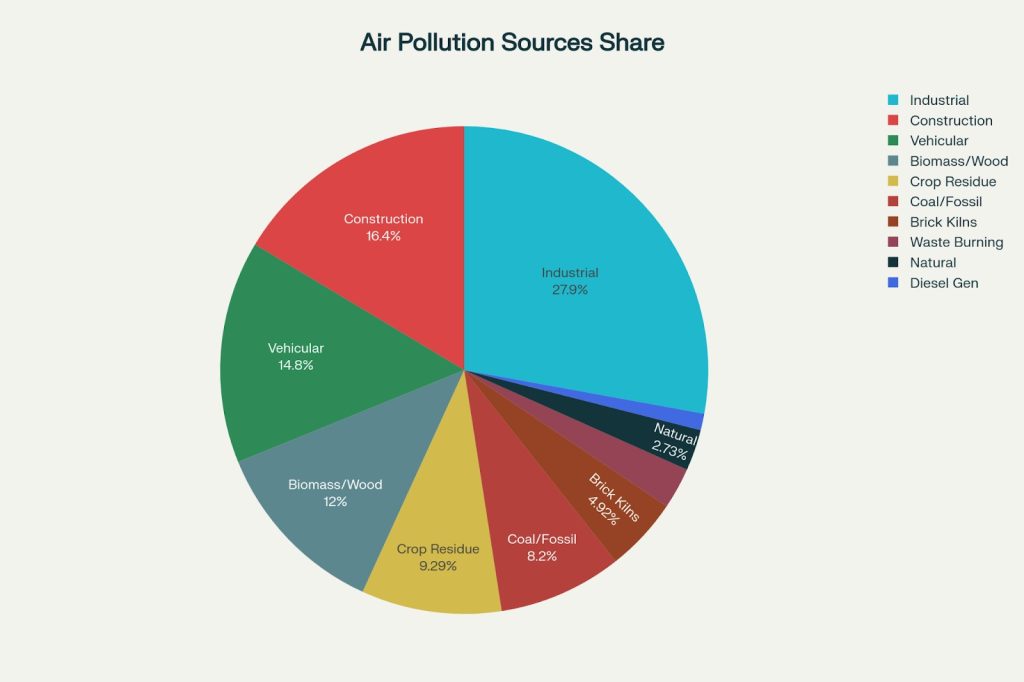
ALL POSSIBLE CONTRIBUTING FACTORS FOR DELHI’S SMOG AND DETERIORATING AIR CONDITIONS EVERY YEAR:
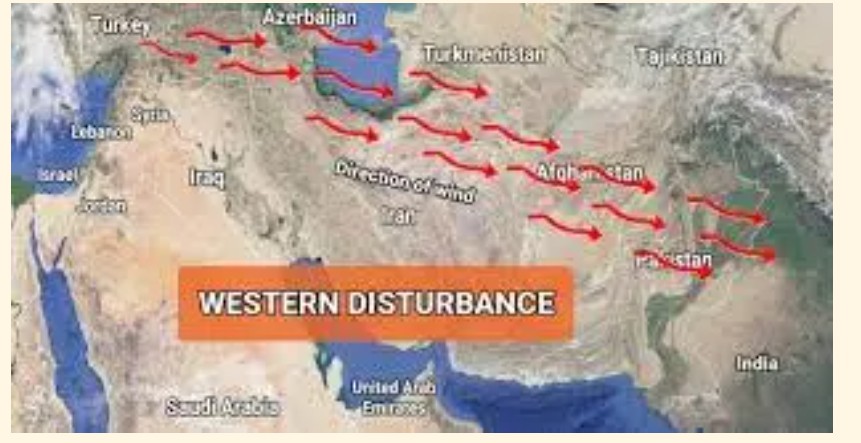
ROLE OF WESTERN DISTURBANCES AND DELHI’S GEOGRAPHY AS CONTRIBUTING FACTORS TO THE AIR POLLUTION PROBLEM
ALL POSSIBLE CONTRIBUTING FACTORS FOR DELHI’S SMOG AND DETERIORATING AIR CONDITIONS EVERY YEAR:
ROLE OF WESTERN DISTURBANCES AND DELHI’S GEOGRAPHY AS CONTRIBUTING FACTORS TO THE AIR POLLUTION PROBLEM
CROSS SECTORAL CRISIS OF AIR POLLUTION:
MULTI LAYERED INSTITUTIONAL FRAMEWORKS AND MECHANISMS TO ADDRESS THE AIR POLLUTION CHALLENGES IN INDIA:
CASES STUDIES AND EXAMPLES OF SUCCESSFUL MANAGEMENT OF AIR POLLUTION ACROSS THE WORLD
EXAMPLES OF SUCCESSFUL MANAGEMENT OF AIR POLLUTION IN INDIA
The rollout of LPG under the Pradhan Mantri Ujjwala Yojana eliminated millions of household biomass stoves, cutting indoor and outdoor pollution.
| AQI Category | AQI Range | Color Code | Health Concern / Impact |
|---|---|---|---|
| Good | 0–50 | Green | Minimal impact. |
| Satisfactory | 51–100 | Light Green | Minor breathing discomfort to sensitive people. |
| Moderate | 101–200 | Yellow | Breathing discomfort to people with lung disease; sensitive groups. |
| Poor | 201–300 | Orange | Breathing discomfort to most people on prolonged exposure. |
| Very Poor | 301–400 | Red | Respiratory effects even on healthy people; serious impact on vulnerable. |
| Severe | 401–500 | Maroon | Affects healthy people; seriously impacts those with lung/heart disease. |
The key air pollutants monitored in relation to Delhi’s air quality, as sourced from the National Air Quality Index (CPCB), include PM10, PM2.5, Sulfur Dioxide (SO2), Nitrogen Dioxide (NO2), Carbon Monoxide (CO), Ozone (O3), Ammonia (NH3), and Lead (Pb).
| Aspect | Air Pollutants | Greenhouse Gases |
|---|---|---|
| Definition | Harmful substances in air | Gases that trap heat in atmosphere |
| Impact | Health & environment (local) | Global warming (global) |
| Key Examples | PM10, PM2.5, SO2, NO2, CO, O3 | CO2, CH4, N2O, CFCs, HFCs |
| Main Concern | Immediate toxicity/smog | Climate change/temperature rise |
| Sources | Vehicles, industries, burning | Fossil fuels, agriculture, industry |
| Feature | Details | |
|---|---|---|
| Name | Graded Response Action Plan (GRAP) | |
| Launched | 2017 (by EPCA, now CAQM) | |
| Purpose | Emergency measures against episodic air pollution | |
| Area of Application | Delhi-NCR region | |
| Trigger | Based on AQI levels and pollution forecast | |
| Key Actions | 4 pollution stages: Moderate, Poor, Very Poor, Severe/Severe+ | |
| Example Measures | Ban on diesel generators, halt construction, odd-even vehicular scheme, dust control, closure of brick kilns, enhanced enforcement | |
| Main Authority | Commission for Air Quality Management (CAQM) | |
| Objective | Protect public health and reduce short-term pollution peaks |
| Aspect | Details | |
|---|---|---|
| Name | National Green Tribunal (NGT) | |
| Established | 2010 | |
| Legal Basis | National Green Tribunal Act, 2010 | |
| Jurisdiction | All of India | |
| Main Role | Adjudicates environmental protection & conservation cases | |
| Powers | Judicial (can issue orders, compensation, penalties) | |
| Headquarters | New Delhi; Regional benches in key cities | |
| Scope | Pollution, forests, wildlife, climate, water, environment | |
| Objective | Fast-track resolution and enforcement of environmental laws | |
| Appeal | Decisions appealable only to Supreme Court |
| Aspect | CPCB (Central Pollution Control Board) | SPCB (State Pollution Control Board) |
|---|---|---|
| Jurisdiction | National (entire India) | State/Union Territory |
| Setup Year | 1974 | 1974 (varying per state) |
| Main Role | Formulates policies, standards, national coordination | Implements regulations, monitoring, enforcement |
| Functions | Research, national guidelines, technical assistance | Local monitoring, industry permits, enforcement |
| Reports To | Ministry of Environment, Forests, Climate Change | Respective State Government & CPCB |
| Headquarters | New Delhi | State capitals |
| Authority | Apex (supreme technical body) | Subordinate / regional authority |